今週はサーバ構築が多くて疲れました。インフラ池田(@mikeda)です。
本番作業時や障害対応時、HTTP応答がどういう状況なのかリアルタイムで確認したいですよね。
でも
- muninは5分おきとかなので遅すぎる
- アクセスログをtail -fしてても速すぎて「なんか流れてるなー」としかわからない
というわけでなんかvmstatっぽく見れないかな、と思って作ってみました。
アクセスログをパイプで流し込むと、指定した秒数ごとにvmstatっぽく表示してくれます。
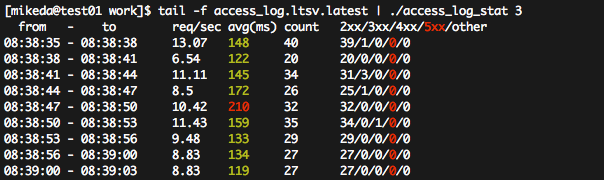
左からこういう情報が並んでます。
- 時間
- request/sec
- 平均応答速度
- アクセス数
- レスポンスコードごとのアクセス数
細かい調整は間にgrepとか挟む感じで。
ソースコードはこんな感じ。とりあえず版です。
#!/usr/local/bin/ruby

DEFAULT_INTERVAL = 3

class AccessCount
  def initialize(interval)
    @interval = interval
  end

  def start
    @count = 0
    @count_status = empty_count_status
    @response_time = 0

    print_header

    [
      Thread.new(&method(:watch)),
      Thread.new(&method(:count))
    ].each{|t| t.join}
  end

  def print_header
    puts "  from   -    to     req/sec avg(ms) count   2xx/3xx/4xx/#{red('5xx')}/other"
  end

  def flush_counter(from, to)
    count, @count = @count, 0
    response_time, @response_time = @response_time, 0
    count_status, @count_status = @count_status, empty_count_status

    rps = ( count / (to - from) ).round(2)
    response_time_mean = count == 0 ? 0 : response_time / count
    time_str = from.strftime('%H:%M:%S') + ' - ' + to.strftime('%H:%M:%S')
    count_status['5xx'] = red(count_status['5xx'])
    status_str = count_status.values.join('/')

    if response_time_mean > 200
      response_time_mean = red(response_time_mean)
    elsif response_time_mean > 100
      response_time_mean = yellow(response_time_mean)
    end

    puts [ time_str, rps, response_time_mean , count, status_str].join("\t")
  end

  def empty_count_status
    {
      '2xx'   => 0,
      '3xx'   => 0,
      '4xx'   => 0,
      '5xx'   => 0,
      'other' => 0
    }
  end

  def watch
    while true
      now = Time.now
      @last_checked ||= Time.now
      sleep 0.1
      if now - @last_checked >= @interval
        flush_counter(@last_checked, now)
        @last_checked = now
      end
    end
  end

  def count
    ARGF.each_line do |line|
      record = parse_line(line)
      next unless record

      @count += 1
      @response_time += record['response_time'].to_i / 1000
      if /(\d)\d\d/ =~ record['status']
        @count_status["#{$1}xx"] += 1
      else
        @count_status["other"] += 1
      end
    end
  end

  def parse_line(line)
    record = {}

    # LTSV用
    line.split("\t").each do |kv|
      k, v = kv.split(":", 2)
      record[k] = v
    end

    ### combined用はたぶんこんな感じ
    ### LogFormatの末尾に%Dを追加してる想定
    #regexp = /^(?<host>[^ ]*) [^ ]* [^ ]* \[(?<time>[^\]]*)\] "(?<path>(?:\\[\\\"]|.)*)" (?<status>[^ ]*) (?<size>[^ ]*) "(?<referer>(?:\\[\\\"]|.)*)" "(?<agent>(?:\\[\\\"]|.)*)"( (?<response_time>\d+))?$/
    #return unless regexp.match(line)
    #m = Regexp.last_match
    #m.regexp.names.each{|name| record[name] = m[name]}

    record
  end

  def red(str); "\e[31m#{str}\e[0m" end
  def yellow(str); "\e[33m#{str}\e[0m" end
end

interval = ( ARGV.shift || DEFAULT_INTERVAL ).to_i

AccessCount.new(interval).start
まとめ
これはけっこう便利そうな気がする。
でもなんか似たようなのが有りそうな気がするので、もっとオシャレなツールがあれば教えて下さい!(あんま調べてないw)